Unlocking Business Insights With KPI Trees
Key Performance Indicator (KPI) trees are invaluable tools for businesses seeking comprehensive insights into their operations. By organising key metrics and performance indicators into a hierarchical structure, KPI trees provide a clear and systematic approach to understanding crucial aspects of a business.
In this blog post, we will explore the questions that KPI trees can answer, shedding light on their significance in driving informed decision-making and strategic planning. We also show you how to create and maintain your KPI Trees.
What happened?
The first question KPI trees can answer pertains to understanding what has happened within a business. By examining historical data and performance metrics, companies can use KPI trees to gain insights into past events and outcomes. This knowledge forms the foundation for identifying trends, patterns, and areas for improvement, allowing organisations to learn from past experiences and make informed decisions for the future.
Why did it happen?
Delving deeper into the area of KPI change causation, KPI trees enable businesses to analyse the factors and drivers behind specific outcomes. By drilling down into the various levels of the KPI tree, organisations can identify the root causes of successes or failures, enabling them to take targeted actions to replicate positive results or address underlying issues.
What’s going to happen?
Anticipating future developments is a critical aspect of strategic planning, and KPI trees play a crucial role in forecasting. By leveraging historical data and trend analysis, businesses can use KPI trees to predict future outcomes and performance trends. This foresight empowers organisations to proactively prepare for potential challenges or capitalise on emerging opportunities.
What should happen next?
KPI trees provide a roadmap for determining the steps and actions required to achieve specific objectives. By aligning critical metrics with strategic goals, businesses can use KPI trees to identify areas that need attention or intervention. This proactive approach ensures that resources are allocated efficiently and that corrective measures can be implemented in a targeted manner.
What do we believe will happen?
Finally, KPI trees facilitate the formulation of informed hypotheses and projections based on existing data and performance indicators. Supported by expert OKR consulting, organizations can synthesize insights from diverse business areas, developing well-founded beliefs about future outcomes. This approach empowers them to make bold yet calculated decisions aligned with their strategic objectives.
Starting A KPI Tree
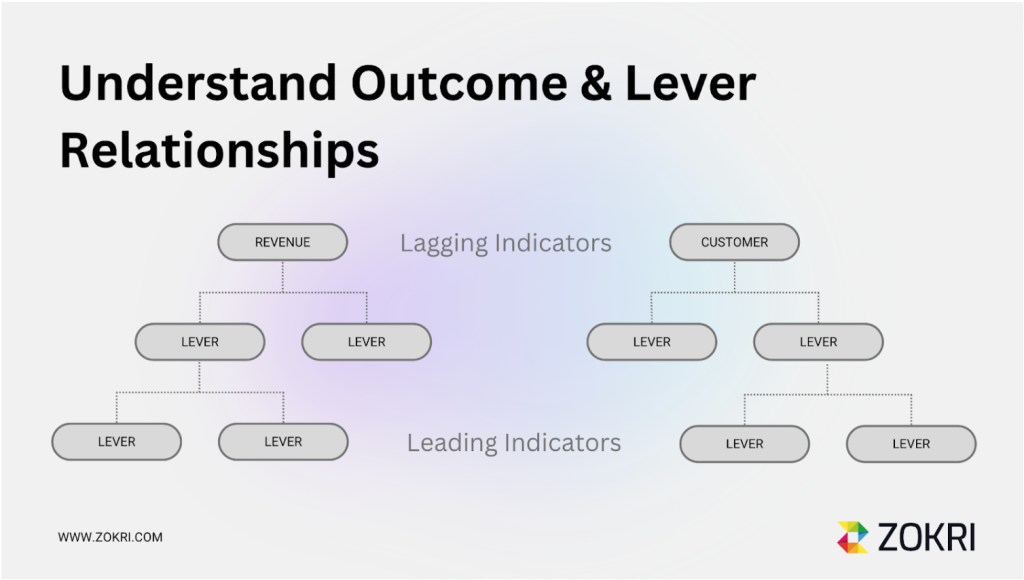
Establishing a solid foundation is essential when developing a KPI (Key Performance Indicator) tree. Common starting points are Revenue, Profit or Customer Retention.
Profit is usually a business’s underlying long-term goal and will consist of revenue and cost branches. Revenue is a fundamental metric that reflects a business’s financial health and growth, making it a natural choice for many organisations. On the other hand, customer retention provides valuable insights into how satisfied customers are with the products or services offered.

Once the starting point is determined, the KPI tree can be expanded to include related metrics and indicators. For example, under the revenue KPI, sub-indicators could consist of average transaction value, closure rate, number of qualified leads, or speed to lead.
Similarly, the customer retention KPI could branch out to encompass Customer Effort score (CES) how hard it is for a customer to use your product or service, Net Promoter Score (NPS) and resolution time for support inquiries. This hierarchical structure provides a comprehensive overview of the factors influencing the chosen KPI, providing valuable insights for decision-making and strategic planning.
The aim is to understand their performance across various areas better. This structured approach enables businesses to track progress, identify areas for improvement, and make informed decisions to drive success.
As the KPI tree grows and evolves, it becomes a powerful tool for aligning organisational efforts, setting targets, and measuring achievements in a meaningful and actionable way.
Growing Your KPI Tree
There are two main ways of growing your KPI tree:
Mathematical Relationships
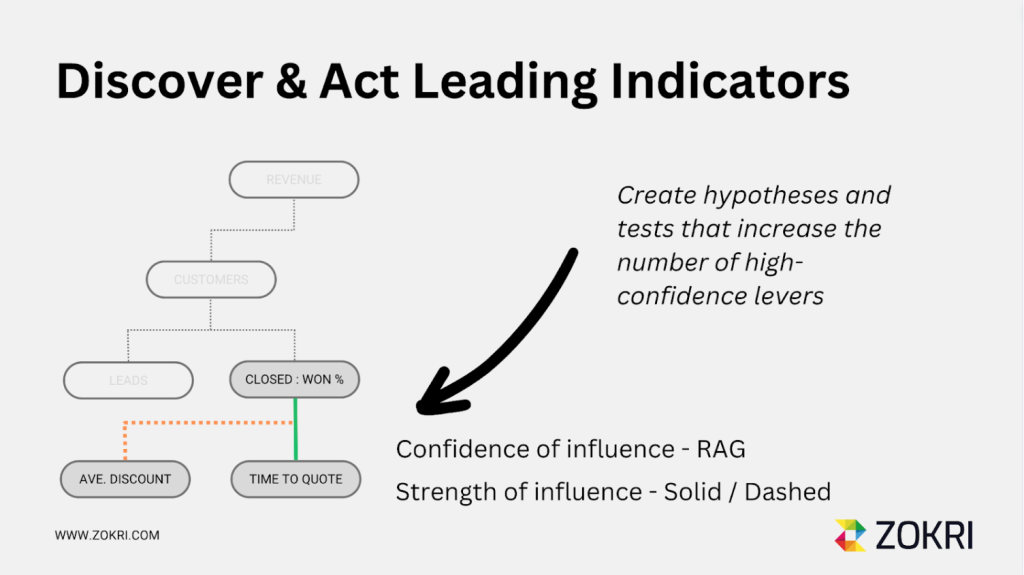
KPIs can be interlinked through mathematical relationships. This means that a KPI is calculated from one or more other KPIs. These relationships are typically represented using solid lines, with an arrow indicating that one metric contributes to the other. Additionally, the level of influence can be expressed using a RAG (Red, Amber, Green) colour system. KPIs can also have named dimensions, such as segment names, further adding depth to the analysis.

Hypotheses
In some cases, metrics may be connected imprecisely, and the relationships between them may not be fully understood. In such situations, it’s important to use dotted lines to represent hypotheses in your KPI tree. This allows you to visually differentiate between established relationships and those that are still under scrutiny. Confidence in these hypotheses can be expressed using a RAG colour system, similar to mathematical relationships.
As your KPI tree evolves, it’s crucial to validate metric hypotheses through experimentation or observation. This process ensures that your KPI tree accurately reflects the dynamics of your business and enables you to make informed decisions based on reliable data. If a hypothesis is found to be inaccurate or incomplete, it should be replaced with a more robust one.
It is also important to capture hypotheses as narratives in the form of beliefs. For example, stating “We believe that…” followed by the hypothesis helps to provide context and rationale for the connections within the KPI tree.
KPI Tree Details
- A tracked KPI should have an owner.
- A KPI in the tree that is tracked can also have people and/or a team that helps to influence that KPI.
- If the KPI is not tracked or unavailable, then that should be clear in the tree. With a label like - NOT TRACKED
- KPI with targets that are being missed should be RED
KPI Tree Use Cases
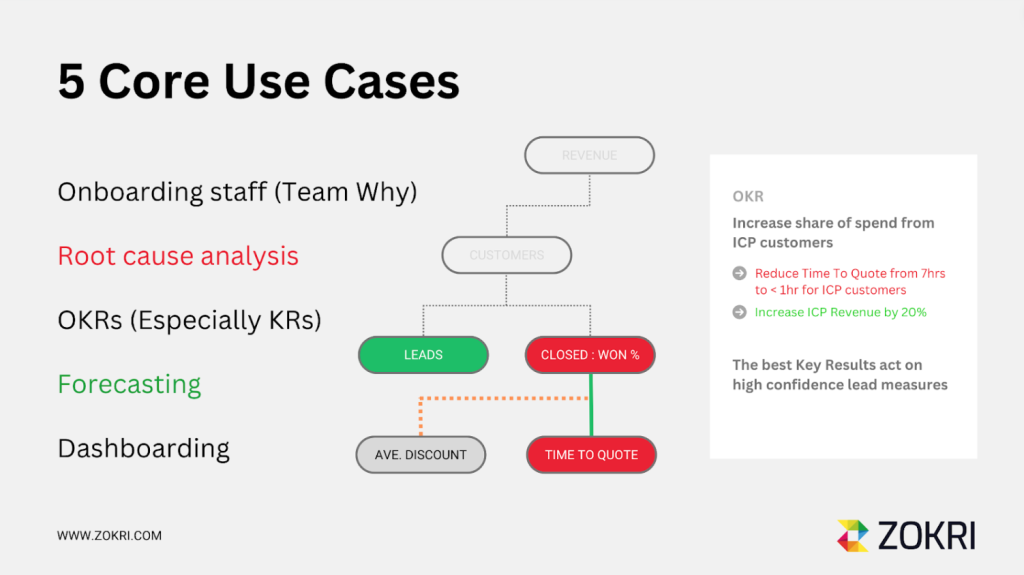
Onboarding Staff
One essential use of a KPI tree is accelerating the onboarding process for new staff members. By mapping out the KPIs associated with roles, they are often categorised under “Team Why,” organisations can identify specific metrics related to staff training, integration, and performance.
Root Cause Analysis
Another crucial use of KPI trees is conducting root cause analysis. Organisations can more effectively identify the underlying causes of issues or challenges by visualising the interconnectedness of different KPIs. This helps explain why certain issues exist and allows for targeted interventions to address the root causes rather than just the symptoms.
OKRs (Objectives and Key Results)
KPI trees are precious in the context of Objectives and Key Results (OKRs). A KPIs Tree helps track progress and enables teams to act on lead indicators, thereby proactively driving performance towards the desired outcomes.

Forecasting
Forecasting is another area where KPI trees prove invaluable. By modelling changes in values and their impact on various KPIs, organisations can gain insights into potential shifts in performance. Additionally, KPI trees can help understand the time it takes for changes in lead indicators to manifest in lagging metrics, thus enabling more accurate forecasting and proactive decision-making.
Keeping A KPI Tree Current
Building your KPI tree is not a one-off event. You must review and revise it regularly to ensure its effectiveness in guiding your business towards its goals.
Here are some key points to consider when keeping your KPI tree current:
Strategy Changes
Revisiting your KPI tree is essential any time your strategy changes. The key performance indicators that were relevant to your previous strategy may no longer align with your business’s new direction.
Significant Discoveries
If you make a significant discovery or revelation that impacts your business operations, it’s essential to reassess your KPI tree. New insights may lead to identifying more relevant or impactful key performance indicators.
Correcting Mistakes
If you find something wrong in your KPI tree, particularly with metrics based on hypotheses, it’s crucial to correct it. Inaccurate or misleading metrics could lead to misguided business decisions.
Regular Checkpoints
Even if none of the situations above happens, create a regular checkpoint to revisit your tree, for example, once a quarter. This ensures that your KPI tree remains aligned with the evolving needs and dynamics of your business.
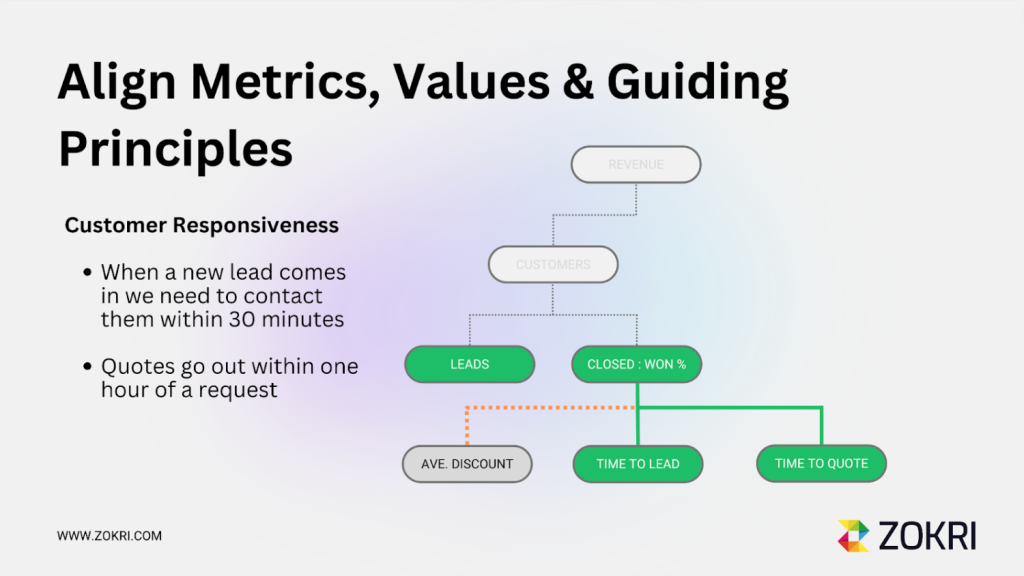
Synchronise Your KPI Tree With Culture
When you find really important levers, you should codify the required and expected behaviours into your values and guiding principles. For example, if Time To Lead and Time To Quote are drivers of Closed Won Deals, you can codify that as a value of responsiveness and then build out the specifics of the required Guiding Principles.

Next Steps
KPI trees offer a structured and systematic approach to understanding key performance indicators and metrics within a business. By addressing questions about past events, causation, future developments, next steps, and informed hypotheses, KPI trees enable organisations to make informed decisions and strategic plans based on comprehensive insights.
Starting a KPI tree involves establishing a solid foundation with fundamental metrics such as revenue or Customer Satisfaction (CSAT) and expanding it to include related indicators. This hierarchical structure provides a comprehensive overview of the factors influencing the chosen KPI, offering valuable insights for decision-making and strategic planning.
Furthermore, as the KPI tree grows and evolves, it becomes a powerful tool for aligning organisational efforts, setting targets, and measuring achievements in a meaningful and actionable way. Whether through mathematical relationships or hypotheses, it’s crucial to validate metric hypotheses as the KPI tree continues to evolve, ensuring that it remains a reliable and insightful tool for driving business success.
Our consultants can help your team learn to use KPI trees as a foundation for executing strategy, setting better outcome-based goals, and driving performance improvements. Our software makes the creation of KPI trees easy and connects them to dashboards and OKRs as required.
- United Kingdom
Ashtead
KT21 1RZ
+44 20 7046 1328

- United States
New York
NY 10013
+1 646-718-4720
- ZOKRI helps leaders and teams achieve strategic goals using the OKR (Objectives & Key Results) framework. Our platform aligns strategy, goals, and people, fostering engagement and growth through comprehensive training and management systems.
© ZOKRI 2025 All rights reserved | Privacy Policy | Terms & Conditions | GDPR
Contacts Us
Tell us what you need. We'd be delighted to help.
"*" indicates required fields